Photovoltaic power plant production and efficiency decrease in time
Each photovoltaic power plant owner wants to know how his or her plant works and what is the rate of its performance drop as time passes. The main question is whether the efficiency decreases as expected. This question has become even more relevant upon the occurrence of a problem called PID (potential induced degradation) or high-voltage stress affecting the panels.
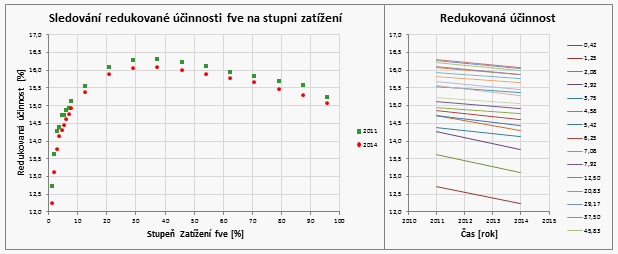
Our experts from Renewable Source Monitoring team are studying this issue closely in order to find the best solutions. They prepared graphical comparison of year-by-year decrease of reduced power plant efficiency (temperature-corrected efficiency) at different load rates. This view eliminates negative effects which otherwise impact on the performance ratio.
The power plant efficiency differs in time and is influenced by the panel temperature and the power plant output (or load rate). This view can be easily created by conversion leading to a comparable view formed by the following graphs.
Finally, only deviation from the initial status which was determined in advance can be viewed.
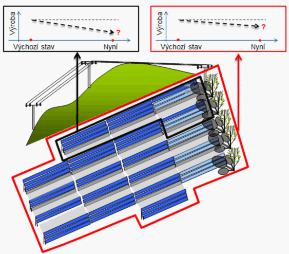
Procedure for comparison of year-by-year decrease of reduced photovoltaic power plant efficiency (temperature-corrected efficiency) at different load rate
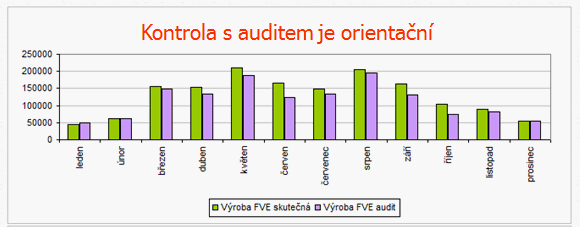
1) Power plant production compared with audit report
- The comparison does not take into account the exposure rate in the respective year and month which can vary significantly.
- The values from audit tend to be overestimated.
2) Comparison of specific production of power plants
- The comparison does not take into account the exposure and power plant technology.
- The actual condition of the compared power plant is unknown.
3) Performance ratio
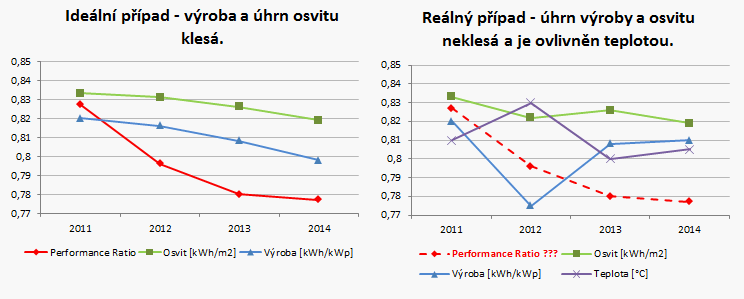
The graph shows that the performance ratio varies from month to month. This variation is critical in summer months when the performance ratio decreases and is not comparable with the performance ratio in other months. This is because the performance ratio does not take into account:
- that efficiency decreases as the temperature increases;
- the dependence of inverter efficiency on output.
Sometimes a diagram indicating production and exposure decrease over years and correct determination of performance ratio can be seen. Such a case is shown on the left graph. On the right, a general example of operation is shown, where the production for a year can be higher than for the previous year, and performance ratio determination where also the panel temperature should be taken into account is outlined.
New methodology for evaluation of photovoltaic power plant production
It was realized during the photovoltaic power plant construction that it consists of inverters and panels where:
- the inverter manufacturer specified dependence of efficiency on output, i.e. euro efficiency;
- the panel manufacturer specified panel efficiency decrease with temperature.
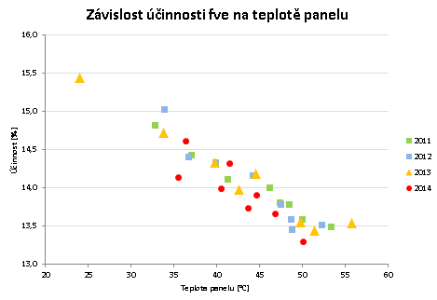
The following graph shows the power plant efficiency relation to panel temperature in the different months.
The graph indicates that in summer months when the temperature is higher (dashed line) the system efficiency decreases (solid line). The same applies to the performance ratio because it depends on temperature like the efficiency. Another graph shows direct dependence of the system efficiency on the panel temperature (with filtered data).
Evaluation
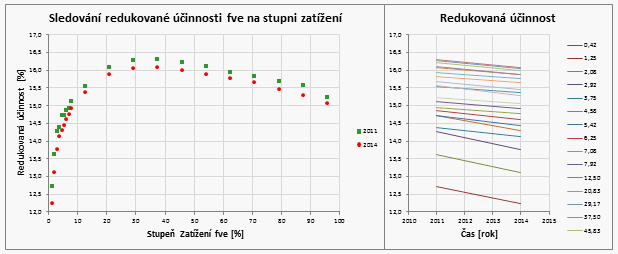
The last graphs combine the panel and inverter efficiency showing the dependence of reduced efficiency (temperature-corrected efficiency) on the photovoltaic system load.
The graphs show year-by-year system efficiency decrease at different system load rates. In this evaluation, we focus on areas where a significant production is achieved. We analyze the power plant efficiency decrease at the highest and medium productions.
Evaluation of converter and string production
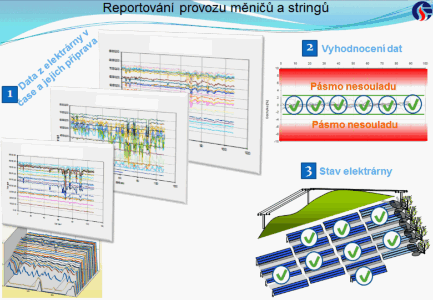
We evaluate the converter and string production applying the following steps:
- Data filtration to remove failure influences
- Evaluation of deviations
- Determination if the deviations are in non/conformity zones which is then reported to the owner
